Debugger#
In WebTigerPython we added a visual Debugger. The Code can be executed step by step, but also Breakpoints can be set.
The Debugger has to be activated within the Settings. When it’s activated, an additional tab is displayed in the output window.
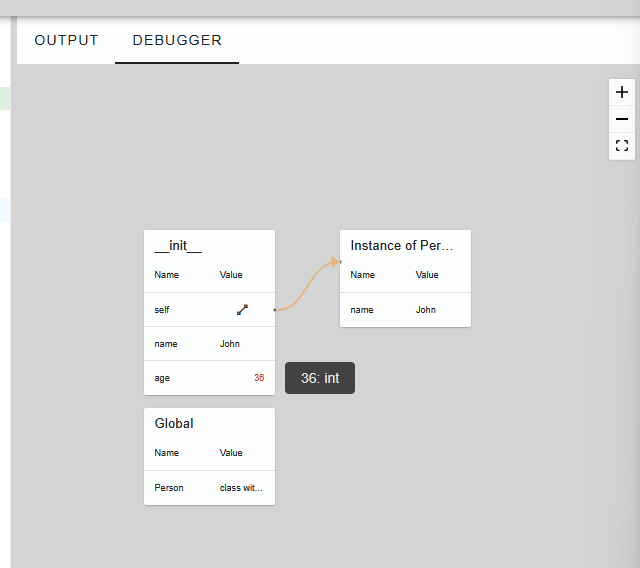
While the scopes are displayed on the left side. The Objects are shown on the right side. Some infos are not displayed by default, but can be seen on hover.
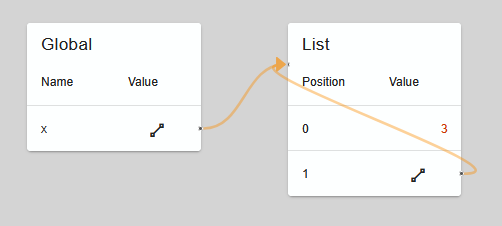
Self Ref#
It is also possible for an object to reference itself.
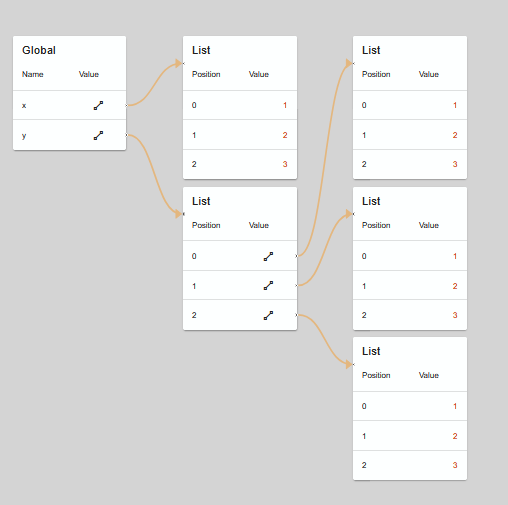
Nested Lists#
Nested lists can also be displayed.
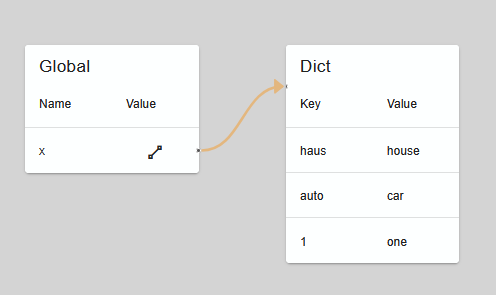
Dictionary#
Also a dictionary can be used with keys of varying types